

President Trump said in his Inauguration speech on January 20th that he would impose tariffs — and he has. Since “Liberation Day” on April 2nd, when tariffs were first announced at rates of up to 48% — we have moved from an effective tariff rate in the U.S. of 2.5% in 2024, to a current effective tariff rate of 18.6%. (Source: Yale Budget Lab)
Here’s how that is costing you in a few charts:
1) The 1st chart shows the loss in disposable income in hard dollars — the money you have available to spend — based on the increased cost of the goods because of tariffs.
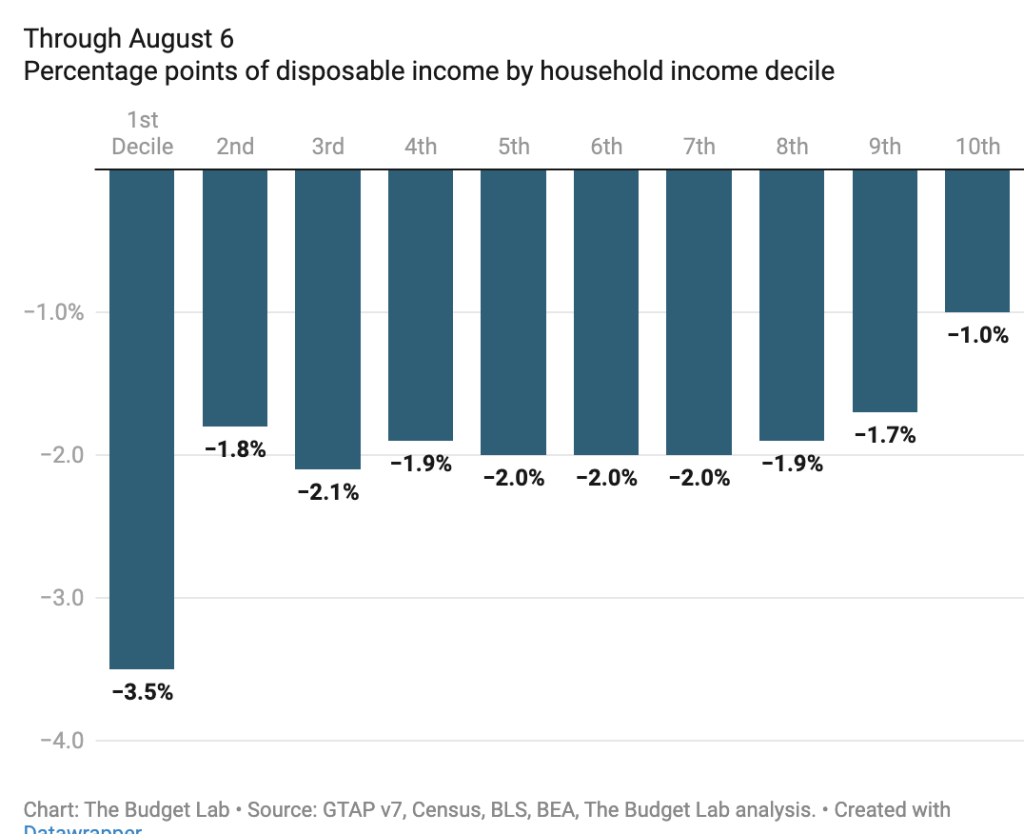
2) The 2nd chart shows the loss in income as percentage of your overall available money to spend.
(1st Decile is lowest 10% by income — poorest. 10th decile is highest 10% by income — richest).

The chart below shows the size of tariffs based on how much the U.S. imported from each country last year. It also shows where tariffs are already in effect or being negotiated. (Source: New York Times)

